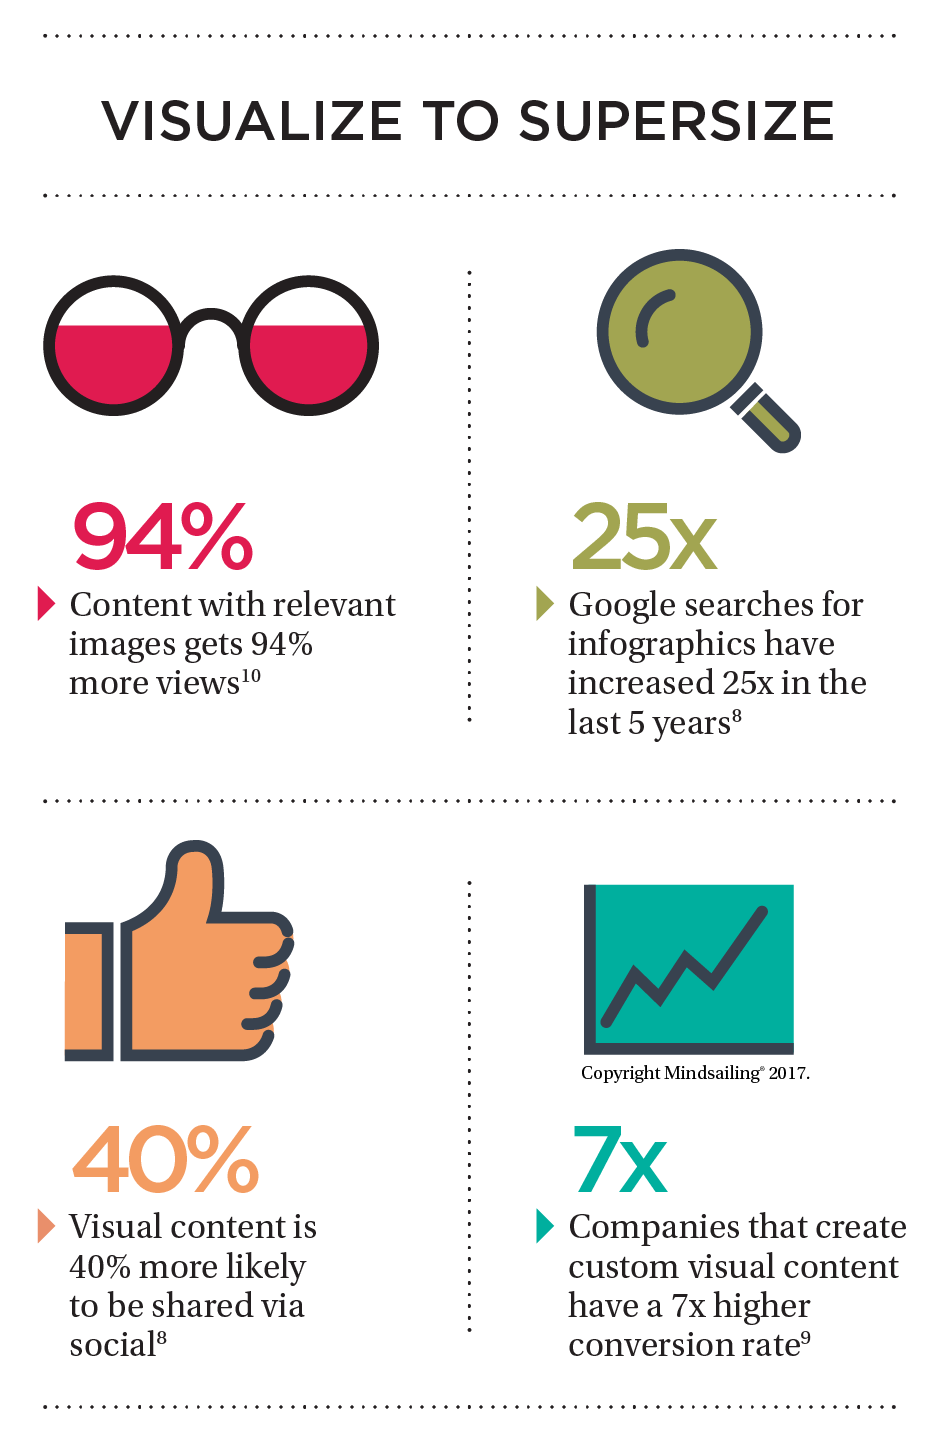
What is the magic of an info + graphic?
It's the hook.
The hook is the insight that turns heads. It's the secret unmasked, the irresistible possibility, the fresh knowledge that can bring new power to the viewer – enabling a new perspective or revelation. Insights can come from simple but astonishing factoids or explanations of complex systems and scenarios. It's utterly charming to have a new insight revealed. The first imperative here is to share information your viewer did not yet know – aka the “hook.”
Faster, better.
Infographics cut through the noise. The faster you make your point, the better chance you have of being viewed, appreciated and shared. Consumers value the immediacy of great infographics and will click through when the hook piques their interest. A good infographic distills an idea in a format that makes the central point instantly recognizable and encourages the reader to explore. The best data for an infographic is proprietary, new and true. But its value comes from the insight it reveals.
Four common types of infographics
The elements composing a data visualization range in sophistication. Like written language that starts with letters – grows into words, combines into sentences and is layered into paragraphs – infographics have a similar structure of combinations and complexity.
Interested in more?
Check out our Infographics Focus Plan: A marketer's guide to creating high-performing infographics.


